Back to Dude Intelligence for Education Main Menu
Key Performance Indicators are quantifiable measurements that show how effectively your organization is achieving key business objectives and compares your performance to peers in your industry. They are commonly used to evaluate the level of success of a particular activity or progress toward a desirable goal. These KPIs report on volume of work, efficiency, and data quality.
This data is updated every month and includes a rolling 12 months worth of data. For example, if you are viewing your KPIs in March 2017, then you will see data from the first of March 2016 through the end of February 2017.
- To download an image of the graph, click on the download icon (
 ).
). - To expand the graph you are viewing, click on the fullscreen icon (
 ).
). - To export your KPI data into an Excel spreadsheet, click on the Excel icon (
 ). *Note: This will only export the data, not the graphs.
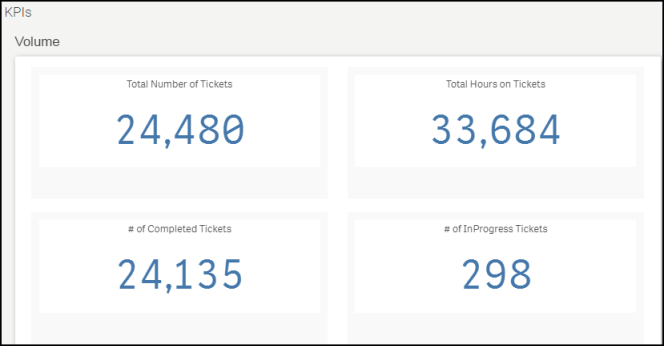
Volume KPIs
Volume KPIs show ticket counts, completion rates, and costs to different metrics.
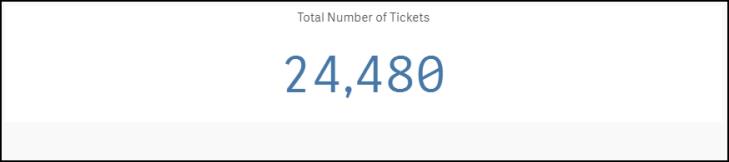
Displays the total number of IT tickets entered in the system over the last 12 months. *Note: This includes all Statuses.
Displays the total number of hours spent on IT tickets over the last 12 months. *Note: This includes hours on all Statuses.

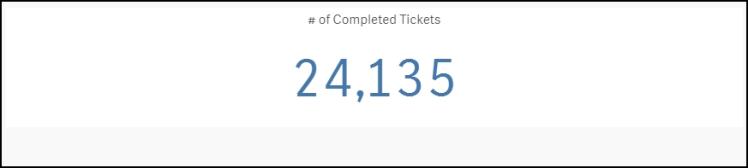
Displays the total number of Completed or Closed IT tickets over the last 12 months.
Displays the total number of In Progress IT tickets over the last 12 months. *Note: This includes New Request, Work In Progress, and ReOpen Statuses.

Displays the total number of Pending IT tickets over the last 12 months. *Note: Pending Statuses include Parts on Order, On Hold, Waiting More Information, Open Extended, Pending, Waiting Funding, and Deferred. The second number displays the number of tickets in the Declined, Duplicate Request, Void, and Forwarded statuses over the last 12 months.

Efficiency KPIs
Efficiency KPIs show how well your organization is performing according to specific metrics.
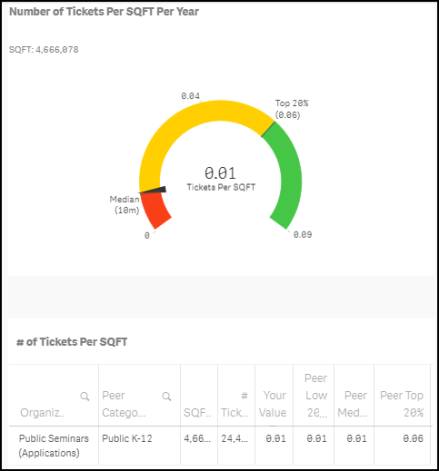
Shows the total number of Closed, In Progress, and Pending IT tickets submitted over the last 12 months divided by the total square footage of your Locations. *Note: This includes Complete, Closed, New Request, Work In Progress, ReOpen, Parts on Order, On Hold, Waiting More Information, Open Extended, Pending, Waiting Funding, and Deferred status.
On the graph, you will see a small indicator that represents where your organization is performing compared to peers in your industry. Your value will be displayed in the middle of the graph.
Green - The green section displays peers in the top 20%.
Blue - The blue section displays peers that are between the median and the top 20%.
Yellow - The yellow section displays peers that are performing below the median.
Red - The red section displays peers that are performing in the bottom 20%.
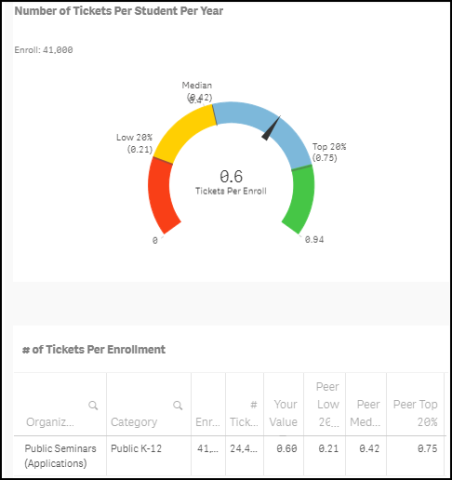
Shows the total number of Closed, In Progress, and Pending IT tickets submitted over the last 12 months divided by your student enrollment from the NCES.org database. *Note: This includes Complete, Closed, New Request, Work In Progress, ReOpen, Parts on Order, On Hold, Waiting More Information, Open Extended, Pending, Waiting Funding, and Deferred status.
On the graph, you will see a small indicator that represents where your organization is performing compared to peers in your industry. Your value will be displayed in the middle of the graph.
Green - The green section displays peers in the top 20%.
Blue - The blue section displays peers that are between the median and the top 20%.
Yellow - The yellow section displays peers that are performing below the median.
Red - The red section displays peers that are performing in the bottom 20%.
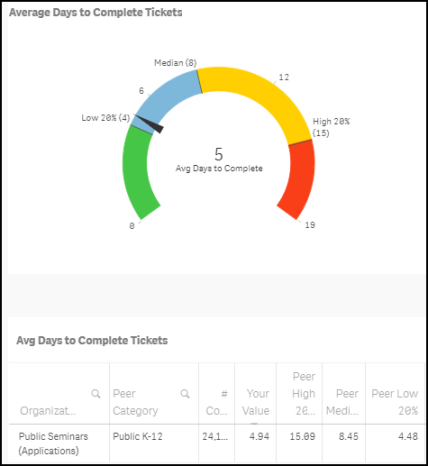
Shows the average number of days it took to complete IT tickets. *Note: If the Start Date is populated, then the calculation uses the Completion Date minus the Start Date. If the Start Date is not entered, the system uses the Completion Date minus the Request Date. If the Completion Date is before the Request Date, then the system calculates 0 days instead of negative days.
On the graph, you will see a small indicator that represents where your organization is performing compared to peers in your industry. Your value will be displayed in the middle of the graph.
Green - The green section displays peers in the top 20%.
Blue - The blue section displays peers that are between the median and the top 20%.
Yellow - The yellow section displays peers that are performing below the median.
Red - The red section displays peers that are performing in the bottom 20%.
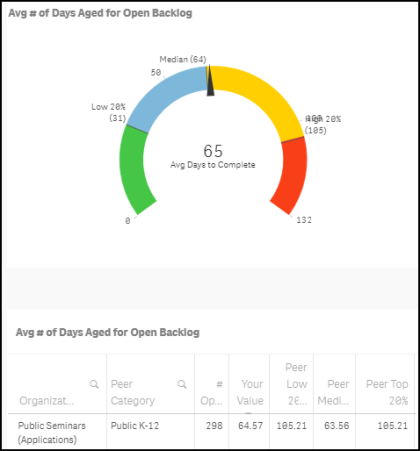
Shows the average number of days aged for incomplete tickets in the backlog over the last 12 months. *Note: This is calculated by looking at Today's Date minus the Estimated Start Date and includes the statuses of New Request, Work in Progress, On Hold, Waiting More Information, Parts on Order, and ReOpen. If the Estimated Start Date is blank, then the system uses Request Date.
On the graph, you will see a small indicator that represents where your organization is performing compared to peers in your industry. Your value will be displayed in the middle of the graph.
Green - The green section displays peers in the top 20%.
Blue - The blue section displays peers that are between the median and the top 20%.
Yellow - The yellow section displays peers that are performing below the median.
Red - The red section displays peers that are performing in the bottom 20%.
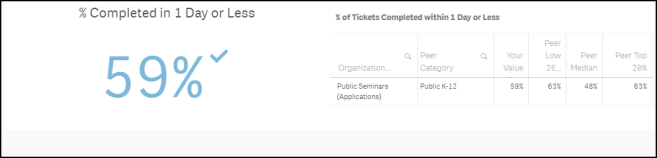
Shows the percentage of Completed and Closed IT tickets that were completed in one day or less over the last 12 months. *Note: If the Start Date is populated, then the calculation uses the Completion Date minus the Start Date. If the Start Date is not entered, the system uses the Completion Date minus the Request Date. If Completion Date is before Request Date, then the system calculates 0 days instead of negative days.
Shows the percentage of tickets that were completed on time. A ticket is considered on time if it has been completed by the Estimated Completion Date or the Actual Completion Date on the request form. If the ticket is completed after one of these dates, it is considered not completed on time. If there are is not a Estimated Completion Date on the request form, the system looks at the Priority:
- Low - user has 7 days to complete the ticket from the request date to consider it on time.
- Medium -user has 3 days to complete the ticket from the request date to consider it on time.
- High - user has 1 days to complete the ticket from the request date to consider it on time.
- Emergency - user has 0 days to complete the ticket from the request date to consider it on time.
![]()
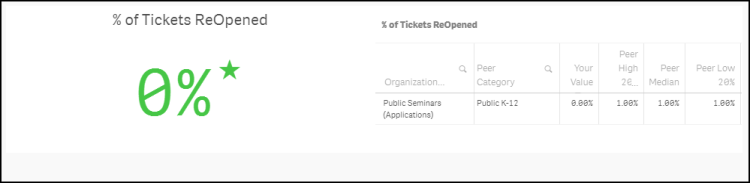
Shows the percentage of tickets that were reopened over the last 12 months. The system checks the Status History to see if the Status of Completed tickets have been changed to ReOpened.
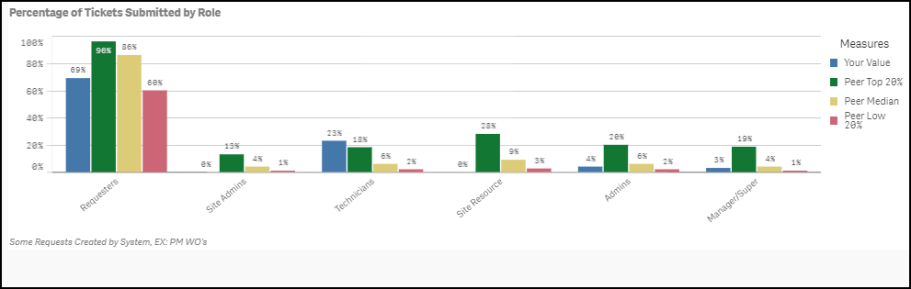
Shows the percentage of tickets submitted by user role.
Blue - The blue bar displays your organization's value.
Green - The green bar displays peers in the top 20%.
Yellow - The yellow bar displays peers that are performing in the median or average range.
Red - The red bar displays peers that are performing below average.
Cost KPIs
Cost KPIs show various costs related to IT Tickets.
Displays the total cost of your IT tickets submitted in the last 12 months. This counts hours on all Statuses and includes Labor, Materials, Contractors, Inventory, and other costs on the ticket.
![]()
Data Quality KPIs
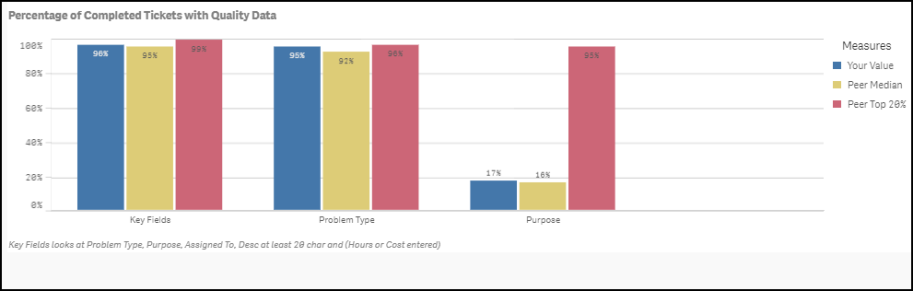
Data Quality KPIs show what percentage of your tickets have quality data entered on them compared to your peers. Tickets that have quality data are ones with Problem Type, Purpose, Assigned To, a Description of at least 20 characters, and hours or costs entered.
Shows the percentage of Complete and Closed IT tickets with quality data. The graph displays a section for Key Fields, Problem Types, and Purpose codes.
Blue - The blue bar displays your organization's value.
Green - The green bar displays peers in the top 20%.
Yellow - The yellow bar displays peers that are performing in the median or average range.
Red - The red bar displays peers that are performing below average.